Public-source market research

Utah Real Estate Market Research

Ten original, dated studies for comparing Park City, Summit County, Wasatch County, Midway, and Salt Lake City. Every report names its geography, period, method, source, and limits.

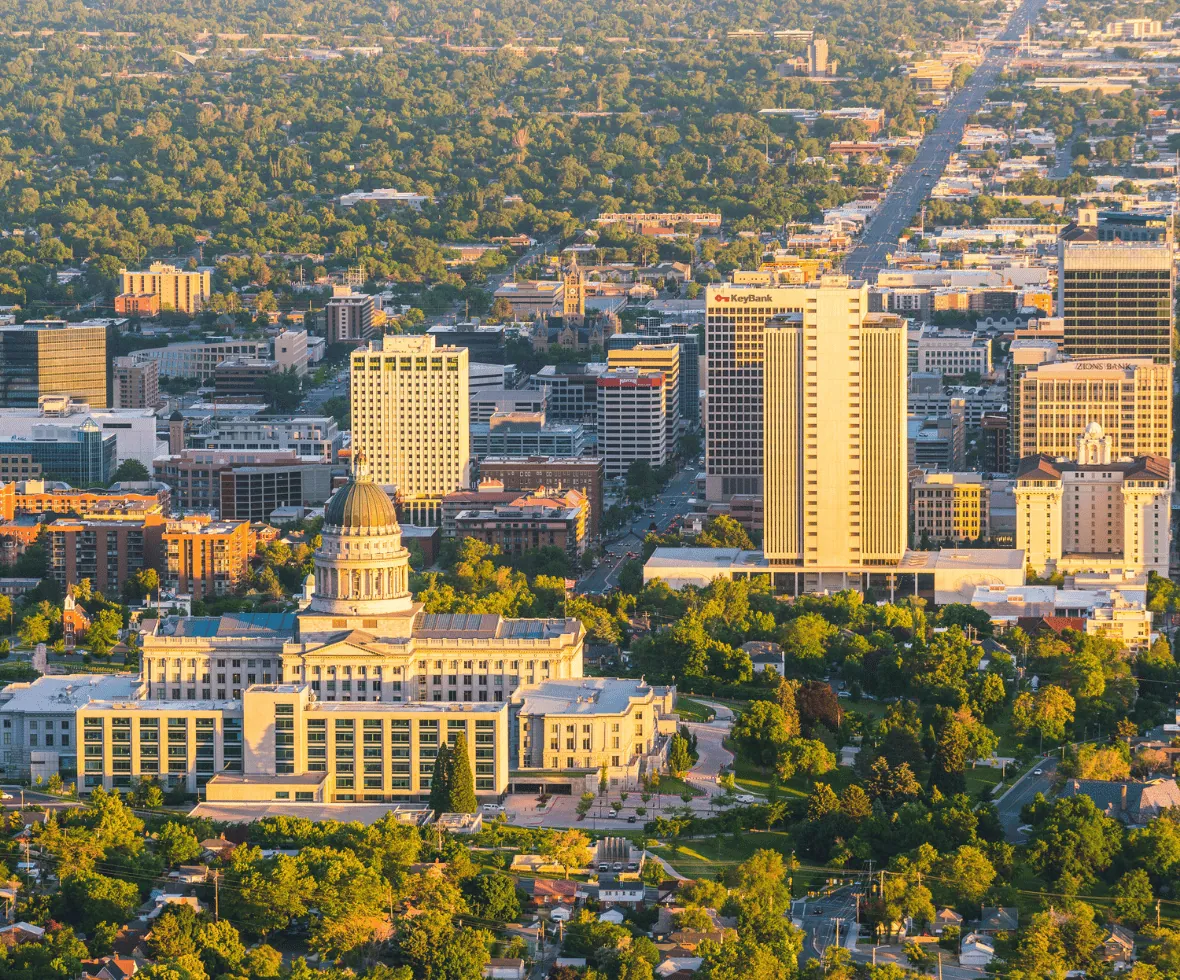
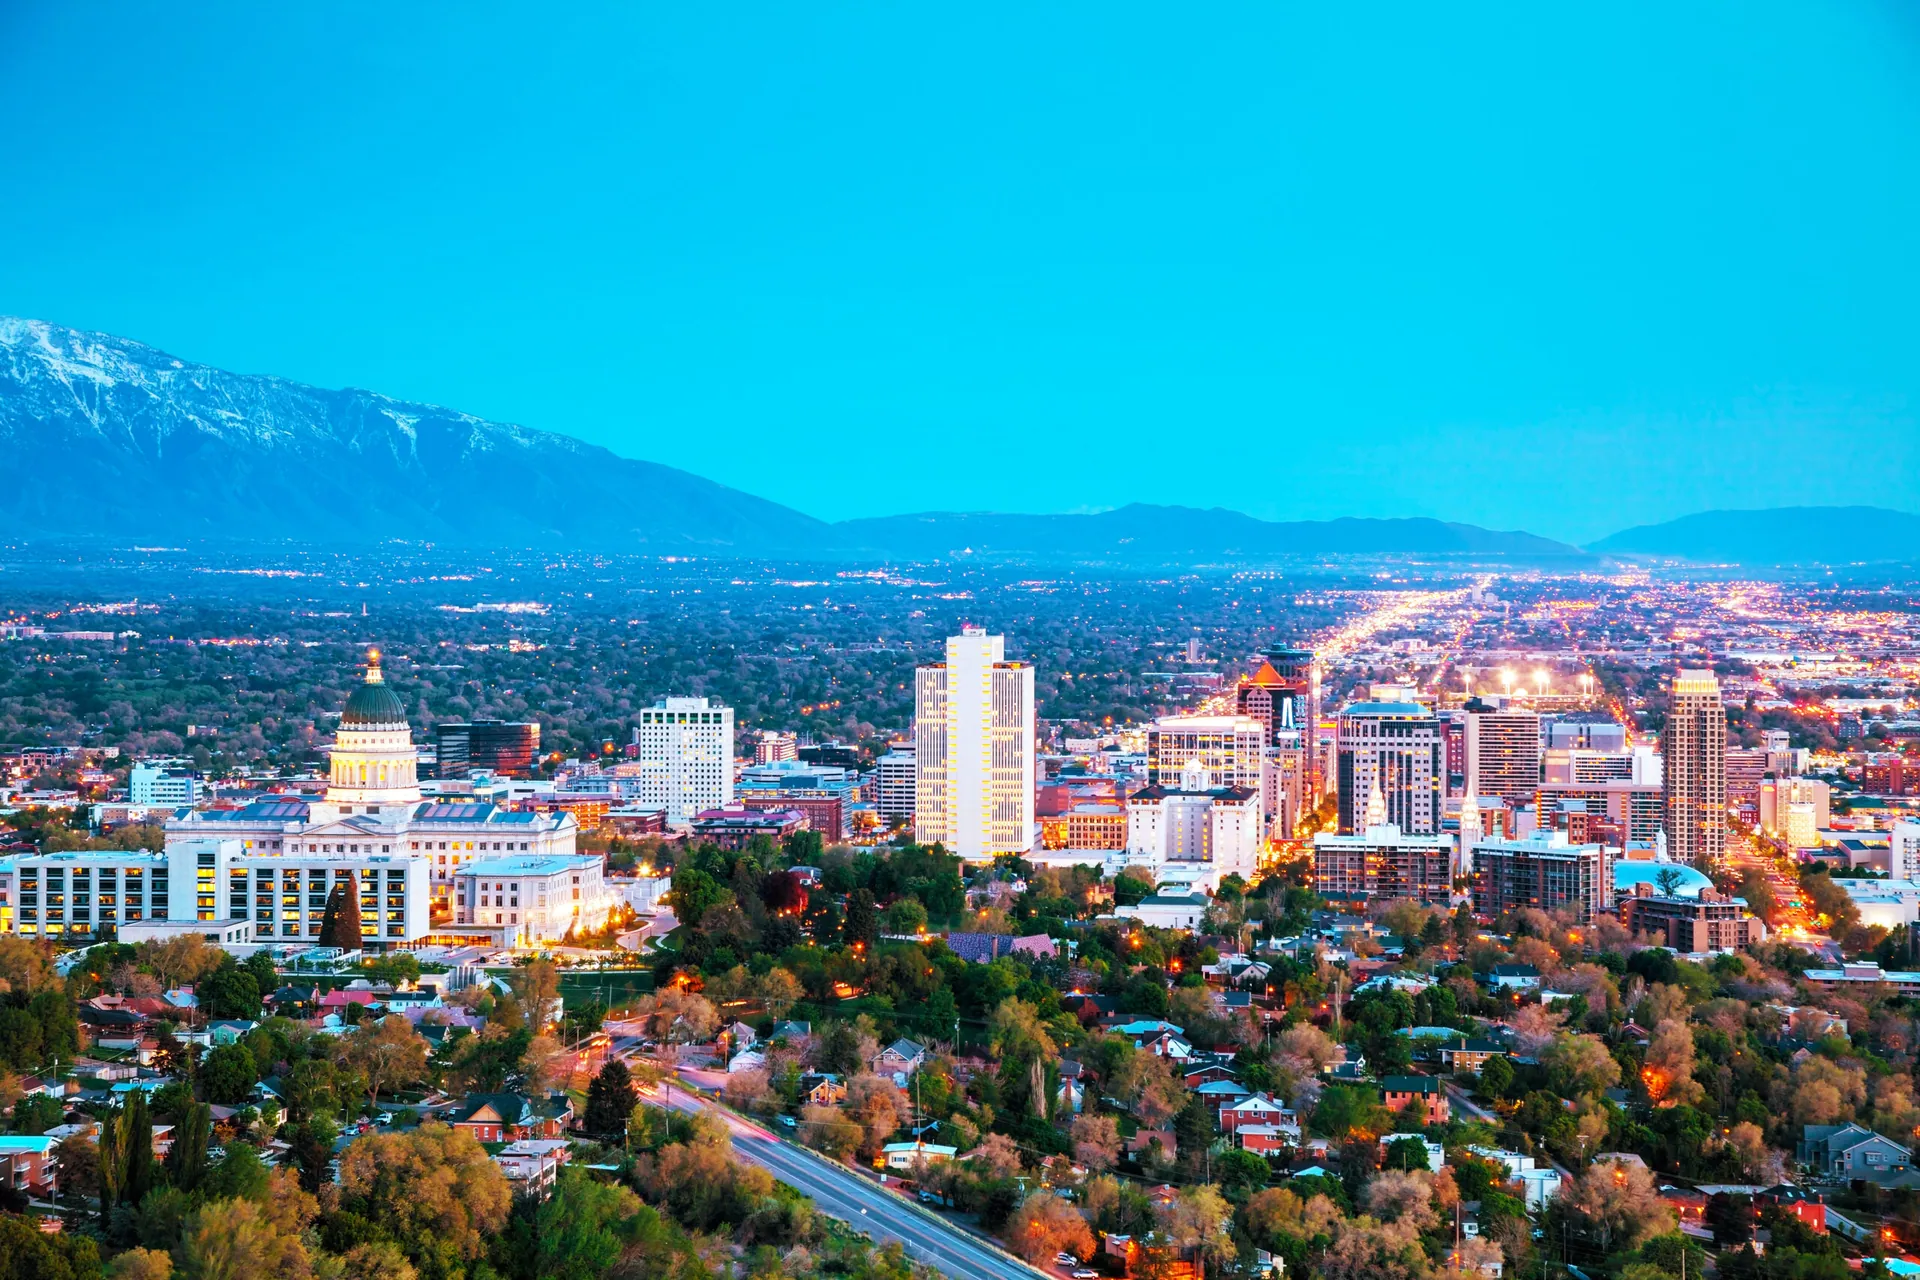
Salt Lake City skyline with the Wasatch Mountains

City-level modeled home values

Park City Home Values in Context, 2019 to 2026

Zillow’s modeled typical home value rose much faster in Park City and Midway than in Salt Lake City from February 2020 to August 2026. The latest year was quieter: Park City increased about 5.0%, Midway 3.7%, and Salt Lake City 2.4%.

CITY: Park City, Salt Lake City, and Midway, Utah

February 2020 to August 2026, with August 2021 and August 2025 checkpoints
Read the full report
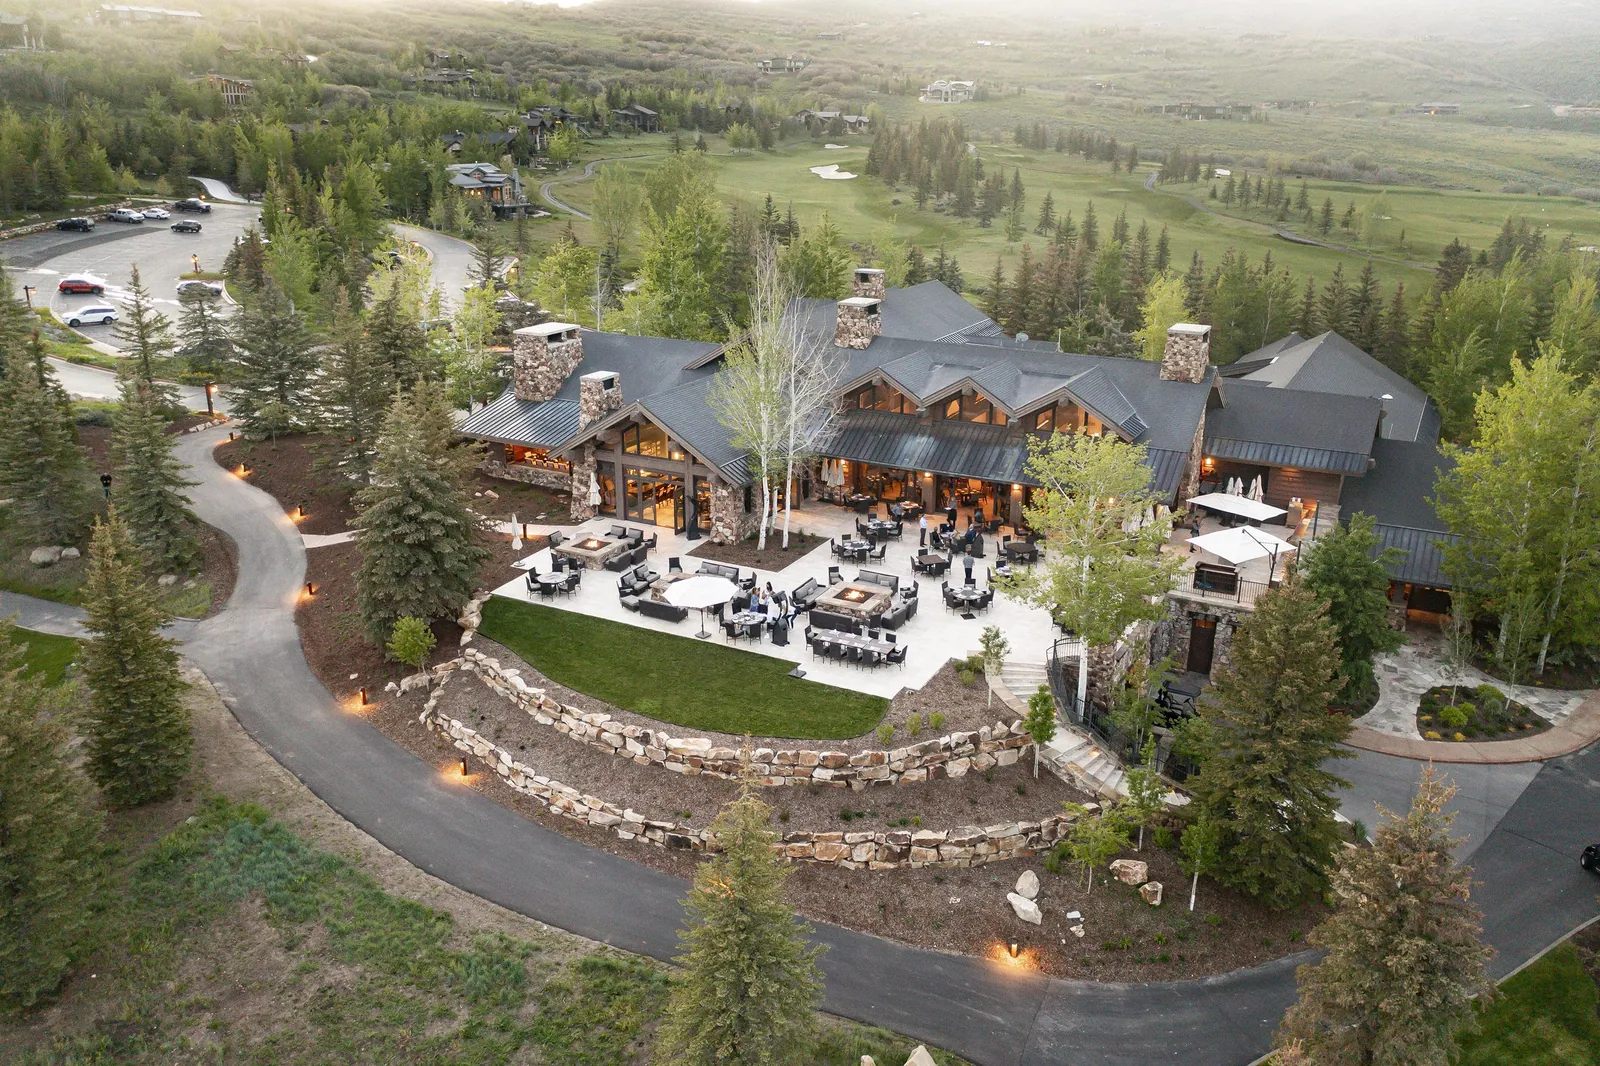
Park City mountain homes and landscape

Closed-sale market conditions

Park City Negotiating Conditions, August 2026

Park City’s three-month median sale price was $2.31 million, but homes took a median 53 days and closed at 95.9% of list price. That combination suggests neither a one-sided buyer market nor uniform seller control.

CITY: Park City; COUNTY: Summit County, Utah

Three months ending August 2026

Read the full report
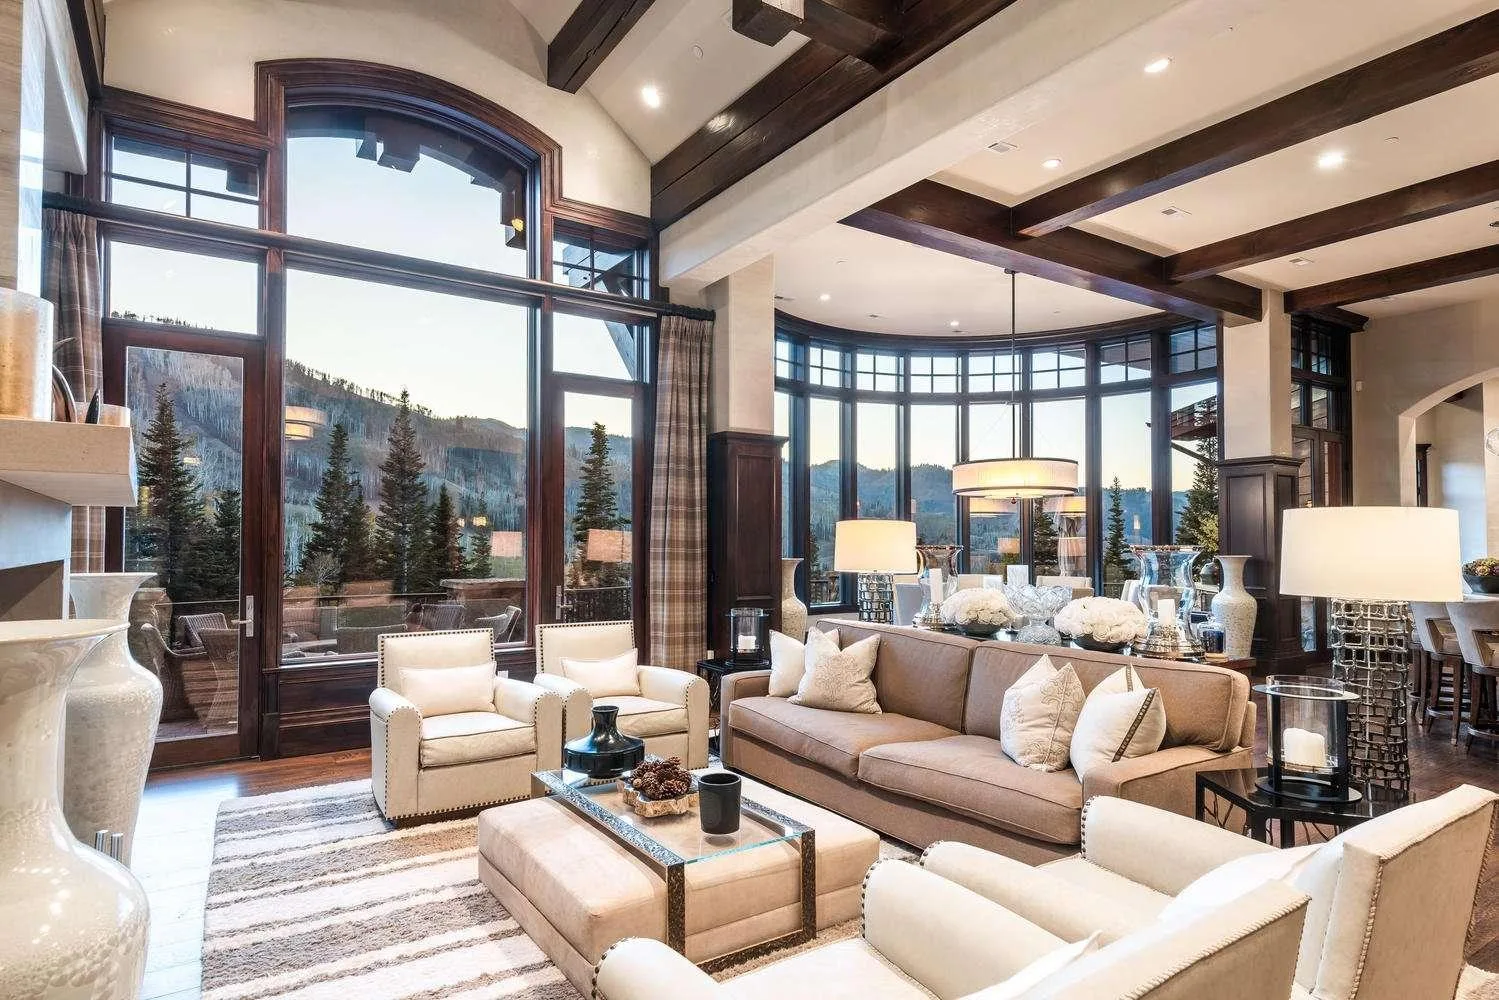
Summit County mountain community landscape

County-level for-sale inventory

Summit County Listing Inventory, 2019 to 2026

Summit County had 891 active listings in August 2026, more than double August 2021’s 360 but still below August 2019’s 1,031. The market has rebuilt inventory without simply returning to its pre-2020 shape.

COUNTY: Summit County, Utah

August observations, 2019 through 2026

Read the full report
Mountain home in the Wasatch landscape

Adjacent county comparison

Summit and Wasatch County Market Split, August 2026

Summit and Wasatch Counties carried similar median asking prices in August 2026, but the supporting indicators diverged. Summit had more active listings and faster market time; Wasatch had fewer new and pending listings and a higher price-reduced share.

COUNTY: Summit County and Wasatch County, Utah

August 2026

Read the full report
Park City mountain real estate in Empire Pass

MLS-region closed transactions

Park City MLS Property-Type Rotation, Q2 2026

The second quarter did not move as one market. Single-family sales increased, condominium activity softened, and land closings jumped. The land surge was concentrated enough that it should not be generalized to every parcel or community.

REGION/MLS: Park City Board of REALTORS service area in Summit and Wasatch Counties

Q2 2026 and rolling 12 months ending June 30, 2026

Read the full report
Utah State Capitol and Salt Lake City landscape

Cross-market decision context

Park City Versus Salt Lake City Market Pace, 2026

Park City carried a much higher typical modeled value and sale price, while Salt Lake City moved faster and had more above-list sales. The two markets also differ in housing mix and geography, so the comparison is best used to set diligence questions rather than declare one market stronger.

CITY: Park City and Salt Lake City; COUNTY context: Summit and Salt Lake Counties, Utah

August 2026, with Zillow values dated August 31 and Redfin three-month measures ending August

Read the full report
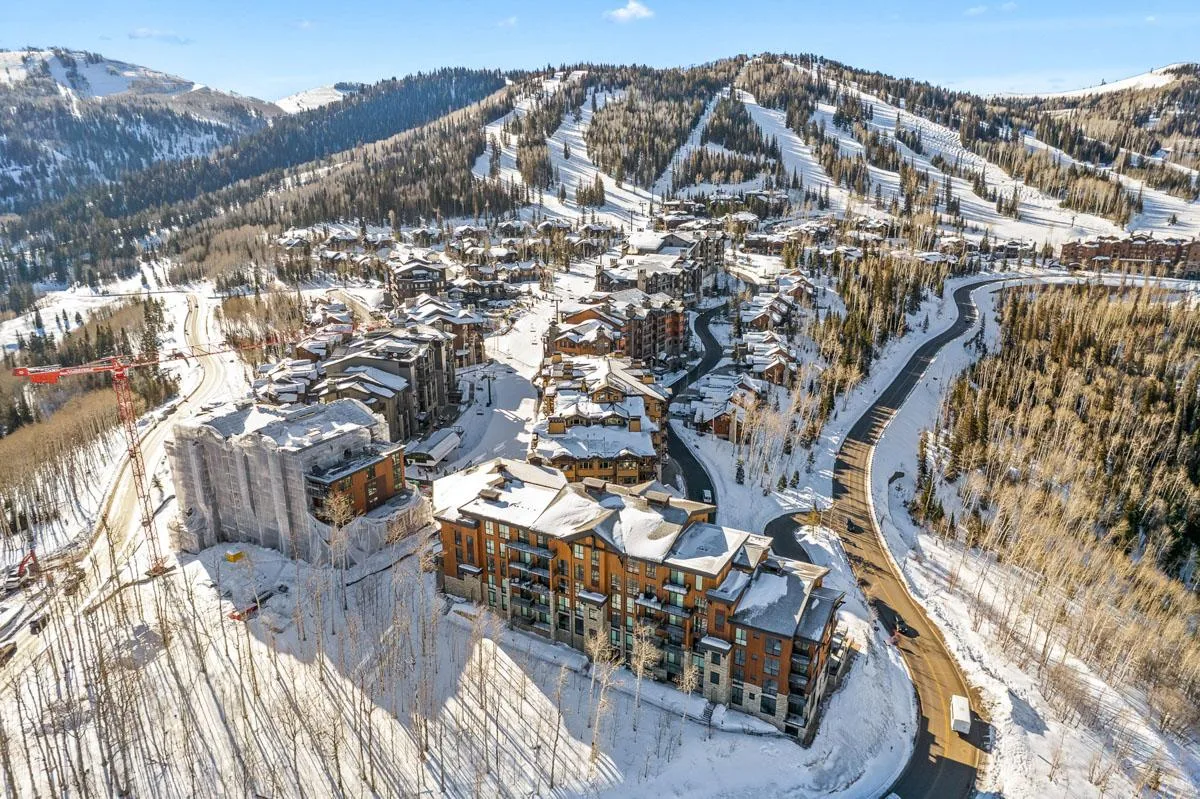
Condominium buildings and mountain landscape at Canyons Village

Condominium geography and product mix

Park City Area Condominium Markets, Q2 2026

The Q2 2026 condominium market did not move uniformly. Jordanelle recorded more transactions, Park City and Snyderville recorded fewer, and Heber Valley recorded a sharp drop. The differences are area-level transaction summaries, not evidence that every condominium in an area changed value by the headline percentage.

REGION/MLS: Park City Board of REALTORS areas in Summit and Wasatch Counties

Q2 2026 compared with Q2 2025; selected rolling 12-month context ending June 30, 2026

Read the full report
Open land and mountain homes in Promontory

Land transaction geography

Wasatch Back Land-Sale Concentration, Q2 2026

Most Q2 2026 primary-market land closings were concentrated in Jordanelle and Snyderville Basin. South Jordanelle and Promontory together accounted for 62 reported sales, so the regional surge should not be generalized to every parcel or community.

REGION/MLS: Park City Board of REALTORS areas in Summit and Wasatch Counties

Q2 2026 compared with Q2 2025; selected rolling 12-month context ending June 30, 2026

Read the full report
Single-family mountain home in the Wasatch Back

Single-family transaction geography

Wasatch Back Single-Family Areas, Q2 2026

The five broad single-family areas had very different Q2 2026 transaction pools. Heber Valley recorded the most sales, Park City carried the highest broad-area median, and selected luxury subareas had samples as small as one to 17 sales.

REGION/MLS: Park City Board of REALTORS areas in Summit and Wasatch Counties

Q2 2026 compared with Q2 2025; selected rolling 12-month context ending June 30, 2026

Read the full report
Salt Lake City and the Wasatch Mountains

County listing adjustment signals

Utah Listing Repricing, January to August 2026

The share of listings with a price reduction rose from January to August 2026 in both Wasatch and Salt Lake Counties. Active inventory also increased and pending ratios ended lower. The pattern is descriptive and seasonal; it does not mean every listing was overpriced or that every buyer gained the same leverage.

COUNTY: Wasatch and Salt Lake Counties, Utah; Summit County limited to quality-flag-0 July and August rows

January through August 2026

Read the full report
Contact Me