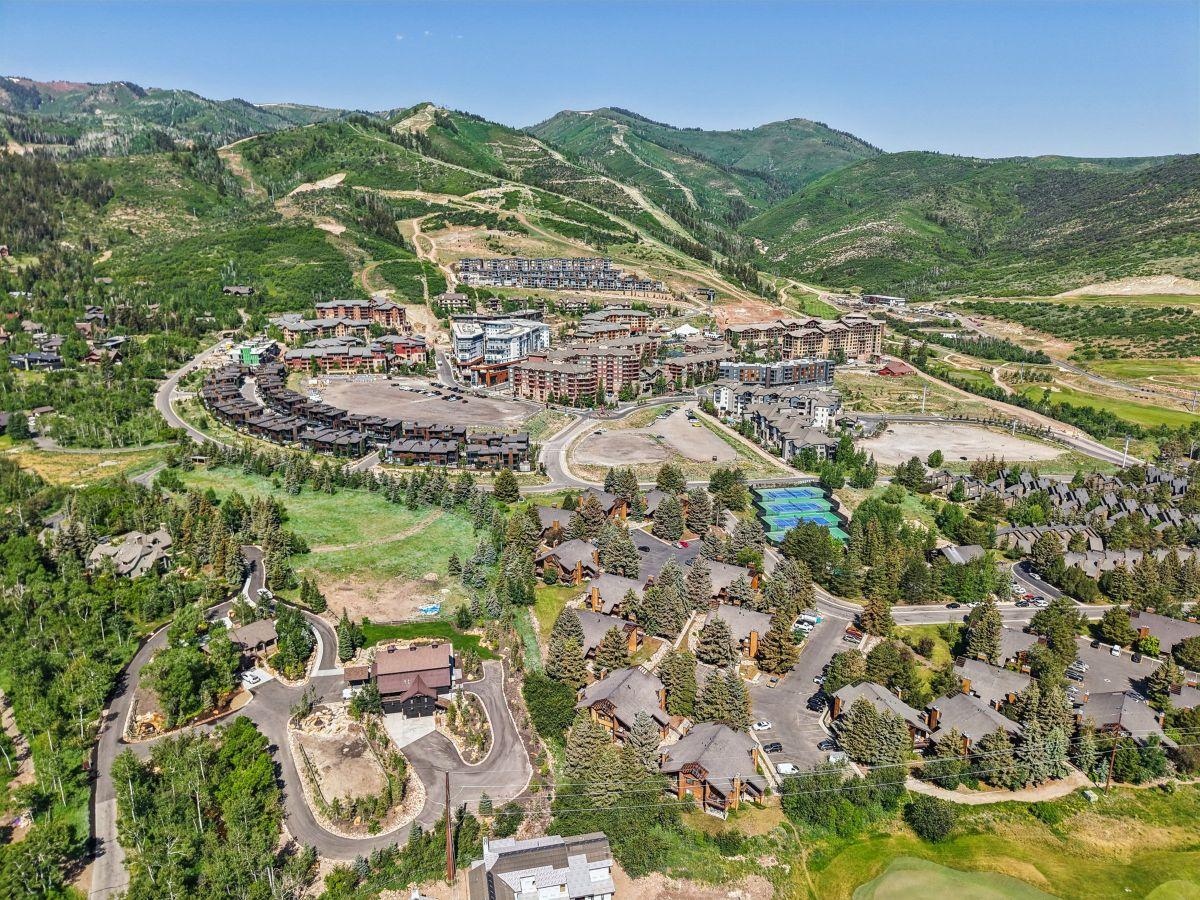
Condominium geography and product mix
Park City Area Condominium Markets, Q2 2026
The Q2 2026 condominium market did not move uniformly. Jordanelle recorded more transactions, Park City and Snyderville recorded fewer, and Heber Valley recorded a sharp drop. The differences are area-level transaction summaries, not evidence that every condominium in an area changed value by the headline percentage.
Geography: REGION/MLS: Park City Board of REALTORS areas in Summit and Wasatch Counties
Period: Q2 2026 compared with Q2 2025; selected rolling 12-month context ending June 30, 2026
189
Primary-area condo sales
Q2 2026, down 6% year over year
+19%
Jordanelle unit change
64 sales compared with 54 a year earlier
-64%
Heber Valley unit change
12 sales compared with 33 a year earlier
The broad areas moved in different directions
Park City areas 1 through 9 recorded 47 condominium sales and $119.6 million in volume, down 11% in units from Q2 2025. Snyderville Basin recorded 58 sales and $100.1 million, down 3% in units but up in dollar volume. Jordanelle recorded 64 sales and $88.6 million, up 19% in units.
Heber Valley recorded 12 sales and $7.8 million, down 64% in units. Kamas Valley recorded eight sales after recording none in the year-earlier quarter. These are different transaction pools and should not be merged into a single area conclusion.
Park City Board of REALTORS condominium results by broad area, Q2 2026
| Area | Q2 2026 sales | Q2 2026 volume | Unit change | Q2 median |
|---|---|---|---|---|
| Park City, areas 1-9 | 47 | $119.6M | -11% | $2.325M |
| Snyderville Basin, areas 10-23 | 58 | $100.1M | -3% | $1.130M |
| Jordanelle, areas 24-29 | 64 | $88.6M | +19% | $1.239M |
| Heber Valley, areas 30-47 | 12 | $7.8M | -64% | $450K |
| Kamas Valley, areas 50-53 | 8 | $3.8M | N/A | $485K |
| Primary market total | 189 | $320.0M | -6% | $1.167M |
- Area
- Park City, areas 1-9
- Q2 2026 sales
- 47
- Q2 2026 volume
- $119.6M
- Unit change
- -11%
- Q2 median
- $2.325M
- Area
- Snyderville Basin, areas 10-23
- Q2 2026 sales
- 58
- Q2 2026 volume
- $100.1M
- Unit change
- -3%
- Q2 median
- $1.130M
- Area
- Jordanelle, areas 24-29
- Q2 2026 sales
- 64
- Q2 2026 volume
- $88.6M
- Unit change
- +19%
- Q2 median
- $1.239M
- Area
- Heber Valley, areas 30-47
- Q2 2026 sales
- 12
- Q2 2026 volume
- $7.8M
- Unit change
- -64%
- Q2 median
- $450K
- Area
- Kamas Valley, areas 50-53
- Q2 2026 sales
- 8
- Q2 2026 volume
- $3.8M
- Unit change
- N/A
- Q2 median
- $485K
- Area
- Primary market total
- Q2 2026 sales
- 189
- Q2 2026 volume
- $320.0M
- Unit change
- -6%
- Q2 median
- $1.167M
Subarea examples show why product mix matters
Canyons Village recorded 28 sales and $68.5 million in volume. Mayflower-Jordanelle recorded 27 sales compared with 13 a year earlier, while its reported median was $1.35 million, down 47%. The source attributes part of the broader pattern to different inventory entering the market, but this report does not independently prove causation.
Heber North recorded zero Q2 2026 condominium sales after 25 in Q2 2025. A zero-quarter result can reflect supply timing as well as demand. It should prompt a closer inventory and development-delivery review, not an unsupported conclusion about all Heber Valley condominiums.
A condominium comparison needs more than a regional median
For a property decision, compare legal form, building, services, age, condition, view, parking, storage, association budget and reserves, assessments, insurance, rental rules, management, and the closest closed and active alternatives.
The area table is useful for selecting the correct comparison pool. It is not an appraisal, a building-level trend, or evidence of future price direction.
Methodology
- 1.Transcribed the official Q2 2026 condominium table published by the Park City Board of REALTORS on September 3, 2026.
- 2.Retained the Board’s area groupings, Q2 comparison period, unit counts, dollar volume, and reported medians.
- 3.Kept source interpretations about product mix separate from independently observed transaction counts.
Limits
- The data is preliminary and may change as late transactions are reported.
- Broad MLS areas contain different buildings and property types. Area medians are not building-level valuations.
- A median can move because the mix of condominiums sold changed. The report does not estimate same-property appreciation.
Sources and provenance
Retrieved: September 29, 2026; published September 3, 2026 for period ending June 30, 2026
MLS-area statistics serving Summit and Wasatch Counties. Figures are preliminary and may change with late reporting.
Companion article