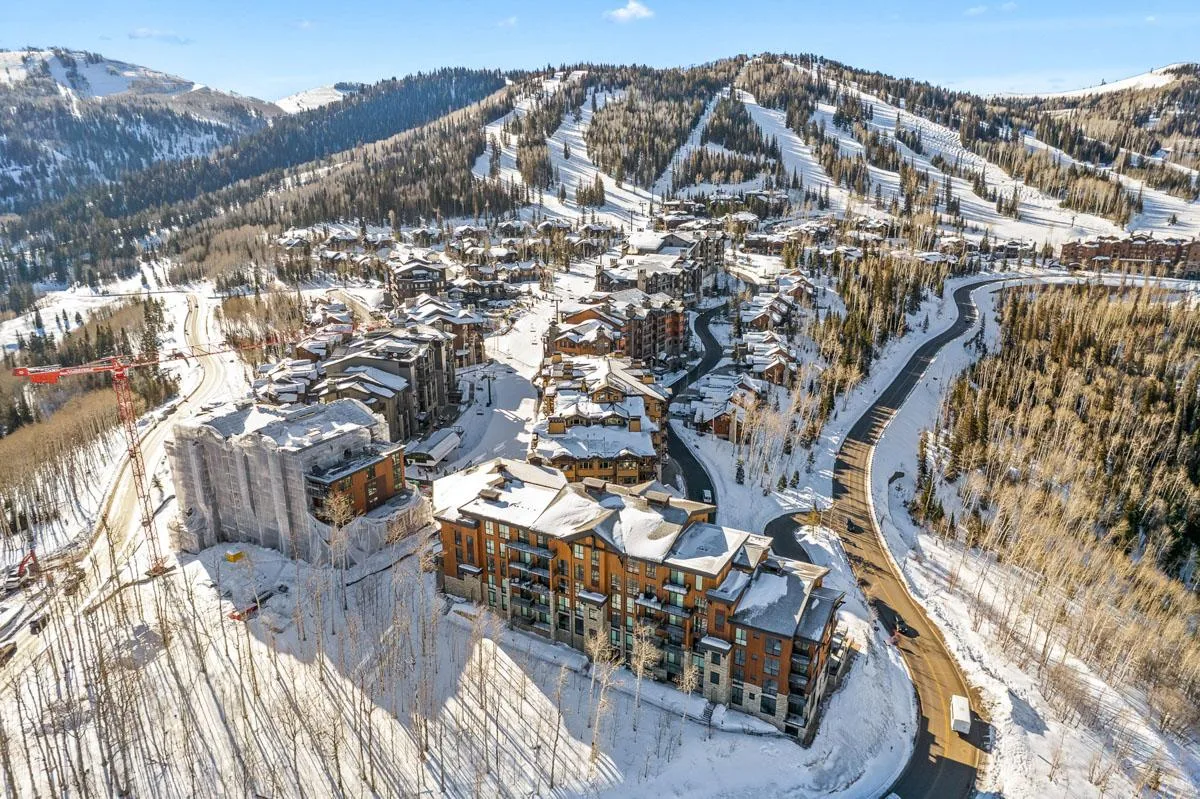
MLS-region closed transactions
Park City MLS Property-Type Rotation, Q2 2026
The second quarter did not move as one market. Single-family sales increased, condominium activity softened, and land closings jumped. The land surge was concentrated enough that it should not be generalized to every parcel or community.
Geography: REGION/MLS: Park City Board of REALTORS service area in Summit and Wasatch Counties
Period: Q2 2026 and rolling 12 months ending June 30, 2026
669
Q2 transactions
+10% year over year across all property types
$1.36B
Q2 dollar volume
+7% year over year
+46%
Land unit growth
147 Q2 closings, with important concentration effects
Property types separated in the quarter
Single-family activity reached 319 transactions and $840.9 million, up 6% in units and 2% in volume. Condominium activity totaled 203 transactions and $335.4 million, down 2% in both units and volume. Land reached 147 transactions and $181.3 million, up 46% in units and 74% in volume.
The rolling 12-month view was also split: single-family units rose 8%, condominium units fell 14%, and land units rose 14%. That is why a single regional headline should not be applied to every property type.
Park City Board of REALTORS regional totals
| Property type | Q2 2026 units | Q2 volume | Q2 unit change | Rolling 12-month units | Rolling 12-month volume |
|---|---|---|---|---|---|
| Single-family | 319 | $840.9M | +6% | 1,341 (+8%) | $3.609B (+15%) |
| Condominium | 203 | $335.4M | -2% | 847 (-14%) | $1.468B (-7%) |
| Land | 147 | $181.3M | +46% | 507 (+14%) | $650.9M (+26%) |
| All property types | 669 | $1.358B | +10% | 2,695 (+1%) | $5.728B (+9%) |
- Property type
- Single-family
- Q2 2026 units
- 319
- Q2 volume
- $840.9M
- Q2 unit change
- +6%
- Rolling 12-month units
- 1,341 (+8%)
- Rolling 12-month volume
- $3.609B (+15%)
- Property type
- Condominium
- Q2 2026 units
- 203
- Q2 volume
- $335.4M
- Q2 unit change
- -2%
- Rolling 12-month units
- 847 (-14%)
- Rolling 12-month volume
- $1.468B (-7%)
- Property type
- Land
- Q2 2026 units
- 147
- Q2 volume
- $181.3M
- Q2 unit change
- +46%
- Rolling 12-month units
- 507 (+14%)
- Rolling 12-month volume
- $650.9M (+26%)
- Property type
- All property types
- Q2 2026 units
- 669
- Q2 volume
- $1.358B
- Q2 unit change
- +10%
- Rolling 12-month units
- 2,695 (+1%)
- Rolling 12-month volume
- $5.728B (+9%)
Local concentration matters
South Jordanelle recorded 41 Q2 land sales, compared with three a year earlier, and $58.2 million in volume. The Board said the jump was almost certainly related to bulk or master-planned closings. That is a useful warning against treating the percentage as broad parcel appreciation.
Promontory recorded 21 land sales and $33.3 million in volume, with a $1.5 million median. Park City areas 1 through 9 recorded only two land sales, with a $2.843 million median. Sample size and product mix are essential to interpreting either figure.
Small samples can move luxury medians
Park City areas 1 through 9 recorded 29 single-family sales and a $3.8 million median. Old Town had seven sales and a $3.65 million median; Park Meadows had 10 and a $3.95 million median. Empire Pass had one sale at $25 million.
These numbers are descriptive, not property valuations. A one-sale area cannot support a stable trend conclusion, and even larger luxury-area samples require a property-level comparable set.
Methodology
- 1.Transcribed the official Park City Board of REALTORS Q2 2026 release published September 3, 2026.
- 2.Kept Q2 and rolling-12-month periods separate and retained the source’s property-type and area definitions.
- 3.Reported the Board’s statement about South Jordanelle concentration as its interpretation, not as independently proven causation.
Limits
- The Board labels the figures preliminary and subject to late-reporting revisions.
- The MLS service area covers Summit and Wasatch Counties; it is not a Salt Lake market series.
- Area medians can be unstable when only a few luxury transactions close. Only source-reported areas meeting minimum thresholds were included.
Sources and provenance
Retrieved: September 29, 2026; published September 3, 2026 for period ending June 30, 2026
MLS-area statistics serving Summit and Wasatch Counties. Figures are preliminary and may change with late reporting.
Companion article