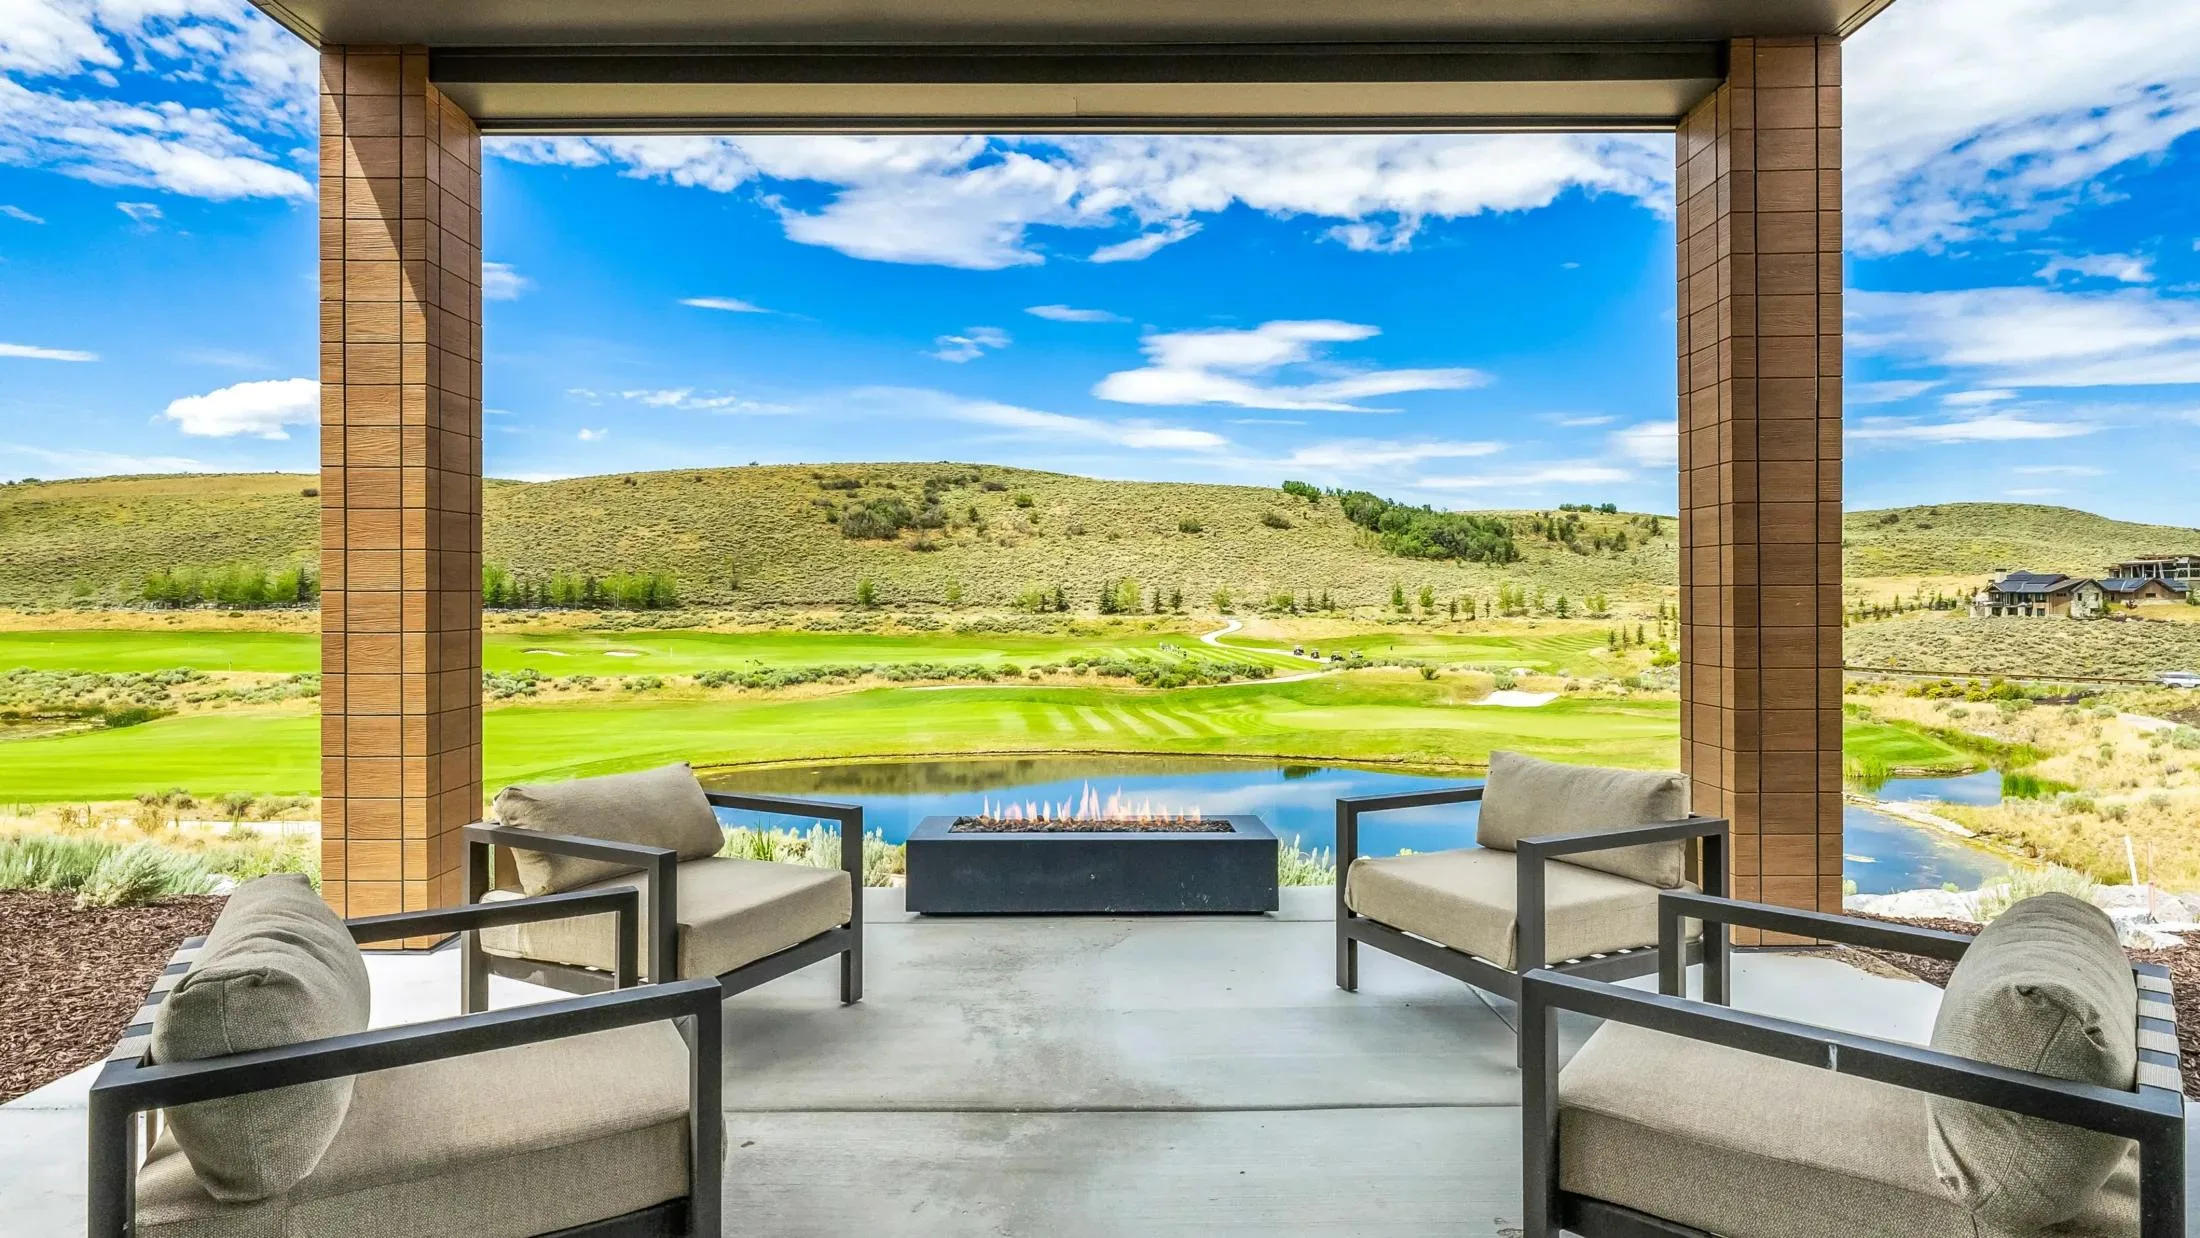
Park City · Q3 2026
Park City Market Report, Q3 2026
Research question
What did the Park City market actually do in the third quarter of 2026?
The top of the market carried the quarter, and homes stopped sitting. Single-family sales across the Park City MLS were flat at 338 against 341 a year earlier, per Park City Board of REALTORS data pulled 5 October 2026, but sales above $2.5M rose 13%, from 122 to 138. The clearest signal is cumulative days on market, which counts the full time a home was for sale across relistings: it fell from 55 days to 43.5 across all sales, and from 72 days to 40 above $2.5M. The all-price median rose 5.9% to $2,012,500 and price per square foot rose 11.3% to $576.60. Buyer demand peaked in the week of 24 August at 159 active buyers, then eased about 19% into late September, which is the seasonal pattern this market runs on every year. More than half of the 472 buyers who searched Park City over those 90 days were looking above $2.5M. This report sets those figures beside that demand.
Geography: REGION/MLS: Park City Board of REALTORS service area in Summit and Wasatch Counties
Period: 1 July to 30 September 2026, compared with the same quarter in 2025
By Kamee Shrope, published
40 days
Cumulative days on market, $2.5M+
Down from 72 days in Q3 2025
+13%
Sales above $2.5M
138 homes, against 122 a year earlier
$2,012,500
Median sold price
Up 5.9% year over year
What sold in the Park City MLS, and for how much?
Roughly the same number of homes as last year, at higher prices per square foot, and after far less time on the market. Per the Park City Board of REALTORS, single-family sales were 338 against 341, while the median sold price rose 5.9% to $2,012,500 and the median price per square foot rose 11.3% to $576.60.
The measure that tells the real story is cumulative days on market, which counts the full time a home was for sale including any relistings. It fell from 55 days to 43.5. Standard days on market, which restarts the clock when a listing comes back on, understates that improvement: it moved only from 42 days to 37.5.
Park City MLS single-family closed sales, Q3 2026 against Q3 2025
| Measure | Q3 2025 | Q3 2026 |
|---|---|---|
| Homes sold | 341 | 338 |
| Median sold price | $1,900,000 | $2,012,500 |
| Median price per square foot | $517.93 | $576.60 |
| Days on market (median) | 42 | 37.5 |
| Cumulative days on market (median) | 55 | 43.5 |
| Sale-to-list ratio (median) | 97.18% | 96.97% |
| Drop from original asking price (median) | 4.76% | 4.57% |
Sources: Park City Board of REALTORS (Flexmls), single-family closed sales, 1 July to 30 September, pulled October 5, 2026. Sold price was not disclosed on six Q3 2026 sales.
- Measure
- Homes sold
- Q3 2025
- 341
- Q3 2026
- 338
- Measure
- Median sold price
- Q3 2025
- $1,900,000
- Q3 2026
- $2,012,500
- Measure
- Median price per square foot
- Q3 2025
- $517.93
- Q3 2026
- $576.60
- Measure
- Days on market (median)
- Q3 2025
- 42
- Q3 2026
- 37.5
- Measure
- Cumulative days on market (median)
- Q3 2025
- 55
- Q3 2026
- 43.5
- Measure
- Sale-to-list ratio (median)
- Q3 2025
- 97.18%
- Q3 2026
- 96.97%
- Measure
- Drop from original asking price (median)
- Q3 2025
- 4.76%
- Q3 2026
- 4.57%
Sources: Park City Board of REALTORS (Flexmls), single-family closed sales, 1 July to 30 September, pulled October 5, 2026. Sold price was not disclosed on six Q3 2026 sales.
Demand swung between 64 and 159 buyers a week, roughly three times the variation Salt Lake City showed over the same thirteen weeks. The peak fell in the week of 24 August; the $2.5M-plus group peaked a week earlier at 79. Source: RealScout buyer activity, exported 2 October 2026.
View the weekly numbers
| Week of | All prices | $2.5M and above |
|---|---|---|
| Jul 6 | 83 | 26 |
| Jul 13 | 107 | 56 |
| Jul 20 | 111 | 56 |
| Jul 27 | 106 | 46 |
| Aug 3 | 102 | 30 |
| Aug 10 | 96 | 44 |
| Aug 17 | 110 | 79 |
| Aug 24 | 159 | 73 |
| Aug 31 | 111 | 50 |
| Sep 7 | 103 | 42 |
| Sep 14 | 82 | 46 |
| Sep 21 | 64 | 38 |
| Sep 28 | 79 | 37 |
How did the market above $2.5M perform?
It grew while the wider market stayed flat, and it stopped lingering. In the same Flexmls pull, sales above $2.5M rose from 122 to 138, up 13%, and cumulative days on market fell from 72 days to 40. Standard days on market fell from 45.5 to 35.5.
The $2.5M-plus median slipped 2.5% to $4,412,500, which reads as a fall in value until you check price per square foot: it moved only 0.9%, from $989.00 to $979.76. A median follows whichever homes happened to close. On 138 sales, a different mix of estates and smaller luxury homes moves it without any individual property losing value.
Sale-to-list held almost exactly flat at 96.82%, so the improvement came through faster sales rather than through sellers conceding more.
Park City MLS homes sold at $2.5M and above, Q3 2026 against Q3 2025
| Measure | Q3 2025 | Q3 2026 |
|---|---|---|
| Homes sold | 122 | 138 |
| Median sold price | $4,525,000 | $4,412,500 |
| Median price per square foot | $989.00 | $979.76 |
| Days on market (median) | 45.5 | 35.5 |
| Cumulative days on market (median) | 72 | 40 |
| Sale-to-list ratio (median) | 96.75% | 96.82% |
| Drop from original asking price (median) | 4.44% | 4.71% |
Sources: Park City Board of REALTORS (Flexmls), single-family closed sales of $2,500,000 or more, 1 July to 30 September, pulled October 5, 2026.
- Measure
- Homes sold
- Q3 2025
- 122
- Q3 2026
- 138
- Measure
- Median sold price
- Q3 2025
- $4,525,000
- Q3 2026
- $4,412,500
- Measure
- Median price per square foot
- Q3 2025
- $989.00
- Q3 2026
- $979.76
- Measure
- Days on market (median)
- Q3 2025
- 45.5
- Q3 2026
- 35.5
- Measure
- Cumulative days on market (median)
- Q3 2025
- 72
- Q3 2026
- 40
- Measure
- Sale-to-list ratio (median)
- Q3 2025
- 96.75%
- Q3 2026
- 96.82%
- Measure
- Drop from original asking price (median)
- Q3 2025
- 4.44%
- Q3 2026
- 4.71%
Sources: Park City Board of REALTORS (Flexmls), single-family closed sales of $2,500,000 or more, 1 July to 30 September, pulled October 5, 2026.
How seasonal is Park City buyer demand?
Sharply, and the quarter shows it. Per RealScout buyer activity exported 2 October 2026, weekly active buyers ran from 64 to 159, nearly tripling between the quietest and busiest weeks, while Salt Lake City held between 130 and 156 over the same period. The peak came in the week of 24 August, and the last four weeks averaged 82, about 19% below the first four.
Over the full 90 days, 472 buyers searched Park City and 244 of them, more than half, were looking above $2.5M. They viewed about seven homes each, half the rate of Salt Lake City buyers. Second-home buyers arrive with a short list and a narrow set of criteria, which is why presentation and pricing in the first weeks of a listing matter more here than almost anywhere in Utah.
In Kamee’s words
What this quarter looked like on the ground
What I saw this quarter
Park City felt interesting this quarter because late summer was more active than I expected. We had buyers in the market and some very significant sales, especially at the higher end. What stood out was that buyers were still being very selective. Just because someone has the ability to spend $3 million, $5 million or even $10 million does not mean they are willing to overpay. The right properties were moving, but buyers took their time when something did not feel like the right value. It comes down to the right list price.
As we moved out of summer and into fall, I felt the market quiet down, but that does not concern me. Park City has always been seasonal, and our slower period typically starts around October as we wait for ski season. There are still buyers looking, and there is also more inventory for them to choose from, which makes pricing and presentation that much more important.
A listing from this quarter
I experienced that firsthand with a listing I had in Hideout. My sellers wanted to start high and test the market, and we went in knowing that was the strategy. I understand why sellers want to do that, especially with a unique property where it is hard to know exactly where the market will respond. But I generally do not recommend testing a higher price for long.
The first few weeks of a listing are incredibly valuable, because that is when you have the attention of the buyers who have been watching and waiting for new inventory. If the price does not line up with what those buyers perceive as the value, they may not make an offer at all. They simply move on and keep watching. Reducing the price later does not always recreate that initial excitement. By then buyers know the home has been on the market, and they start wondering how motivated the seller is. You are much better off creating a sense of value when you first hit the market than chasing the market with reductions later.
Should you list now, or wait for ski season?
There is no single answer. If your home has strong fall views, outdoor living, acreage or a setting that shows well without snow, I would not automatically wait. There is real value in getting in front of buyers before ski season begins. And there is a factor none of us control: we actually need to get snow.
If the biggest selling point is ski access, proximity to the lifts or the winter lifestyle itself, waiting until there is snow on the ground may make more sense. Some properties tell their story better in ski season. Even then, look at the winter we are actually having rather than assuming December is automatically best.
What I would tell any Park City seller is not to decide on the calendar alone. Look at your neighbourhood, your competition, who the likely buyer is and what makes your property special. Park City is not one market. What happens in Deer Valley can be very different from Promontory, Old Town, Jeremy Ranch, Hideout or Jordanelle. Understand where your property sits within its own market, price it accordingly, and bring it out when we can give buyers the strongest reason to choose it.
Questions this report answers
Is the Park City real estate market slowing down?
Not on the evidence of the third quarter of 2026. Single-family sales were flat at 338 against 341 a year earlier, sales above $2.5M rose 13%, and cumulative days on market fell from 55 days to 43.5. Buyer demand did ease about 19% from its late-August peak into late September, which is the normal seasonal pattern before ski season.
What is the median home price in Park City?
The median single-family sold price across the Park City MLS was $2,012,500 for the third quarter of 2026, up 5.9% from $1,900,000 a year earlier. Above $2.5M the median was $4,412,500.
How long do homes take to sell in Park City?
A median of 37.5 days in the third quarter of 2026, or 43.5 days counting the full time across relistings. Above $2.5M, cumulative days on market fell to 40 days from 72 a year earlier.
Why did the Park City luxury median fall while sales rose?
Because a median follows which homes happened to close. The $2.5M-plus median slipped 2.5% to $4,412,500 while price per square foot moved only 0.9%, from $989.00 to $979.76. That is a change in the mix of homes sold, not a fall in value across comparable properties.
When is the best time to list a home in Park City?
It depends on the property rather than the calendar. Homes whose appeal is fall views, outdoor living or acreage often show better before snow arrives, while homes whose main draw is ski access or proximity to the lifts usually tell their story better once there is snow on the ground. Weekly buyer demand peaked in late August and eased about 19% by late September.
How many buyers are shopping in Park City above $2.5M?
244 of the 472 buyers who searched the Park City market over the 90 days to 28 September 2026, more than half the active pool. Weekly counts for that group peaked at 79 in the week of 17 August.
How were these figures produced?
- Closed sales pulled from the Park City Board of REALTORS Flexmls system on October 5, 2026, for single-family homes, 1 July to 30 September 2026 and the same dates in 2025.
- Cumulative days on market counts the full time a home was for sale across relistings; standard days on market restarts when a listing returns to market. Both are reported here because luxury homes are relisted often enough that the two diverge.
- Sale-to-list uses the final list price. The drop from original asking compares the sold price with the first asking price.
- Buyer-demand counts come from RealScout, exported October 2, 2026. Weekly averages exclude the week of 29 June, when tracking began mid-week.
What are the limits of this data?
- The Park City MLS service area carries listings beyond the city boundary, across Summit and Wasatch Counties, so these figures describe the MLS area rather than Park City proper.
- Sold price was not disclosed on six Q3 2026 sales, so those transactions are absent from the price measures.
- Medians on a market of this size move with the mix of homes that close. Price per square foot is the steadier reading.
- Buyer-demand figures reflect buyers active on RealScout, not every buyer in Park City, and second-home markets carry out-of-state demand that may search elsewhere.
Where do these numbers come from?
Every figure on this page comes from one of the sources below, each listed with the date it was pulled and what it does and does not cover.
Park City Board of REALTORS (Flexmls)
Pulled October 5, 2026, for closed sales 1 July to 30 September 2026 and the same quarter in 2025
Single-family closed sales across the Park City MLS service area, which carries listings beyond the city boundary itself. Cumulative days on market counts the full time a home was for sale across relistings. Sold price was not disclosed on six Q3 2026 sales, so those are absent from the price measures.
RealScout buyer activity, Kamee Shrope’s brokerage search platform
Exported October 2, 2026, covering 29 June to 28 September 2026
Counts buyers with a live saved search matching the market in a given week, and the homes they viewed. These are buyers active on RealScout rather than every buyer in the market: a sample of real behaviour, not a census. The week of 29 June is excluded from averages because tracking began mid-week.
Thinking about buying or selling?
A county median cannot price your home. A comparable set can.
Request a valuation for your addressFor longer studies drawn from public data, see the market research library, or browse every quarterly market report.